INTERNET MARKETING SUCCESS

|
Ready to learn a quick-and-easy way to get traffic predictions for any amount of time in the future? Seriously. This article will show you how you can:
Want to skip the info and just click a few buttons?While we’ll be going through running the code to forecast your web traffic and what each of the sections does, you can skip this and jump right to the Colab here if you aren’t interested in knowing what’s going on and how to make adjustments. For those who want to run the code locally and be able to edit the hyperparameters (a fancy name for some of the variables that do important things and generally have one value for a complete run of a model) let’s go! Important note before you begin: The further ahead you ask it to predict, the wider the gap between the low and high estimates gets as the model becomes “less sure of itself.” How to forecast your Google Analytics trafficWe’ll be using two systems to accomplish our goal:
For those who wish to run locally, you can obviously do so, and the code provided will get the job done. So, let’s dive in and get you predicting your future traffic! 1. Connect your instanceWhat this means is you’re “turning on” Google Colab so you can run scripts from it. 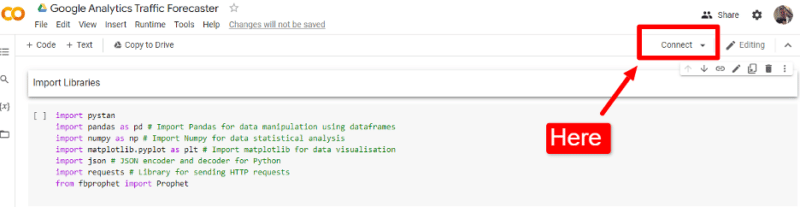
2. Import the needed librariesThe next thing we need to do is to import the libraries we need to make all this work. They are:
To run is all you need to do is click the play button. 
You’ll see a bunch of downloads start and the play button turn into a spinning icon indicating it’s working, and when they’re done downloading and installing the play button with re-appear. 3. Sign up for Google Analytics demos & tools
You need to log in using the Google account tied to the analytics you want to access. 4. Configure the analytics you’re pullingNext you need to select the account, property and view you want to pull your traffic data from. 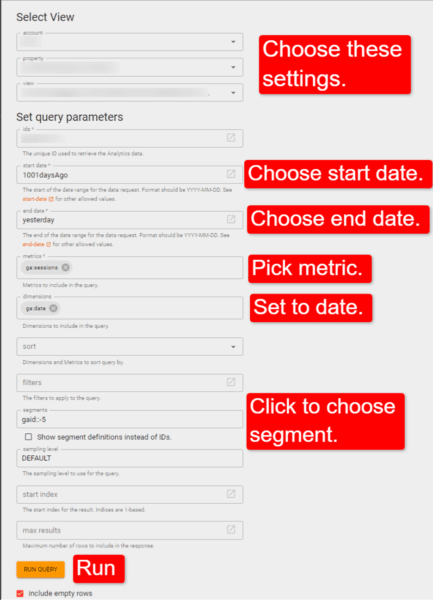
Where it notes to pick a metric, you can pick from many of your traffic metrics depending on what you want to know. Examples might be:
Additionally, when you click the “segments” field a list of all the segments for the property (including custom segments) will display so you can select what traffic you want to look at. After you’ve run the query just copy the API request URL: 
5. Import analytics into the colabClick the play button in the next cell: 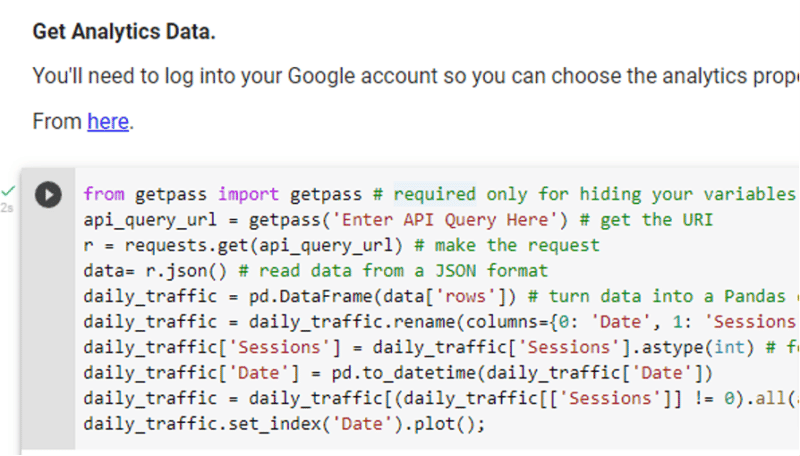
You will be asked to enter the API query you just copied: 
Paste it in and hit “Enter.” You should be presented with a graph of the traffic over the data range you selected: 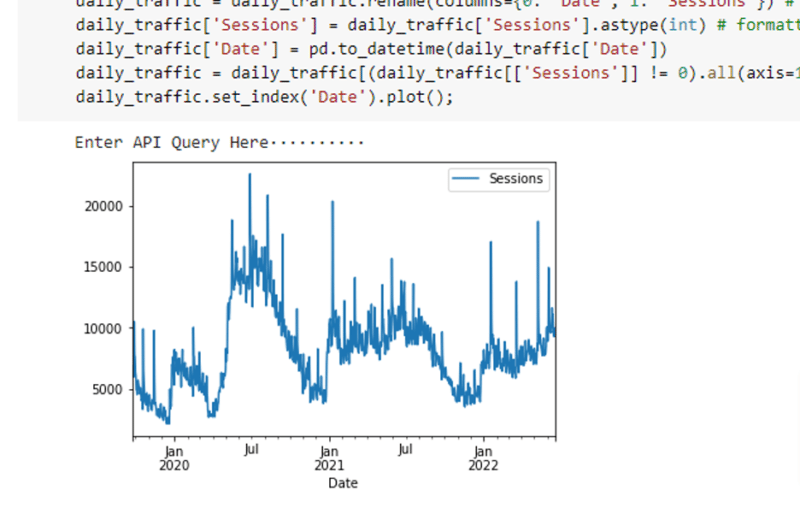
6. FormattingThe next cell just changes the column headings to what Facebook Prophet expects. 
7. (Optional) SaveThis step is completely unnecessary if you don’t plan on referencing back to the traffic numbers or forecasted numbers. I personally find it handy, but some won’t. 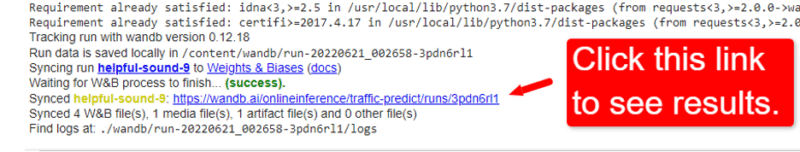
The first thing you’ll track is simply the traffic numbers (same as you could export). 
I promise it gets more interesting. 8. Adding holidaysThe next step is to add holidays and to determine how seasonality is considered. There are some options and ways you can tweak things, or you can run it as is. 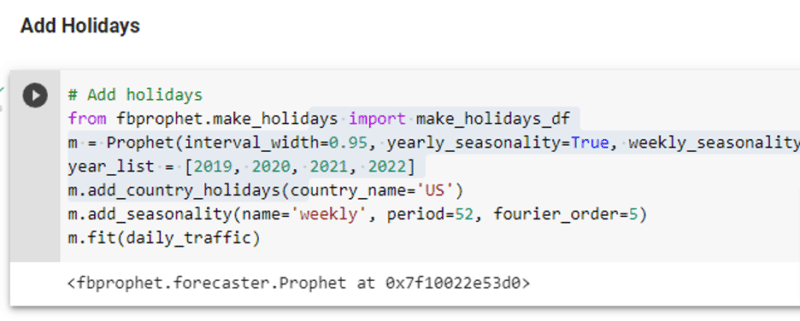
The decisions you need to make are:
Additionally, you’ll notice the line:
You can change any of the parameters to suit your needs, though these settings should work decently in most scenario:
This is a tip-of-the-iceberg scenario. There are other parameters you can review and apply as you feel so inspired. Details on them are available here. I’ve set things here to what seems to work well for me in most (but not all cases). Yearly and monthly seasonality impact most businesses. Daily, not so much. 9. Crunch the numbersThankfully you don’t have to do it. Simply click the run button. 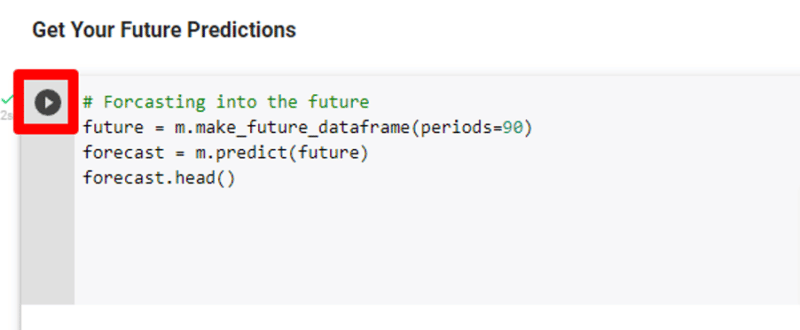
And you’ll soon see: 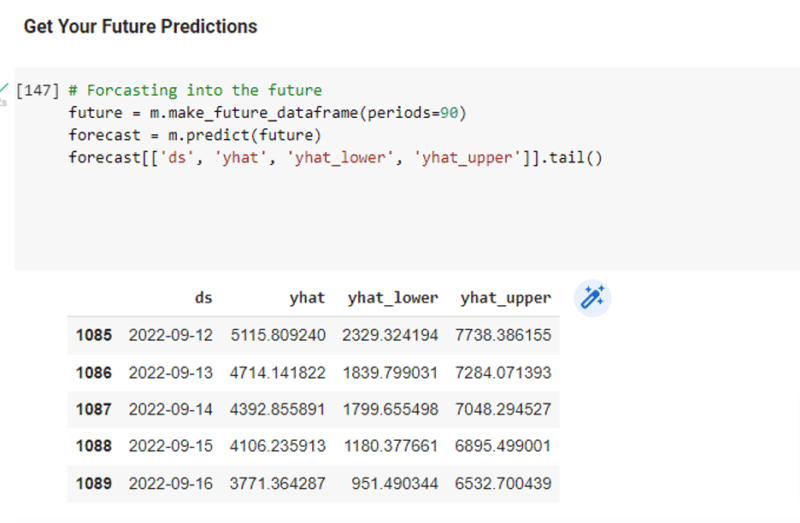
Not all the rows or columns are showing. If they were, what you’d see is:
Importantly, you’ll see “periods=90” in the code above. That is the number of days I’m going to get predictions for. I’ve found 90 works decently. After that, the range gets pretty large between high and low but can be interesting to look at. 10. (Optional) Save predictionsThis is an optional step for those who would like to save their predicted values, or use them to test against different parameter values (those discussed in step eight above). Once run, you’ll just click the link: 
Which takes you to: 
Each time you run it your numbers and results will be stored and can be easily accessed at a future time to compare with different runs. It will also give you the numbers to reference if you’re ever asked for a predicted value for a specific day. 11. The magicHit the run bottom and you get what you’ve likely come here to get. 
OptionalI’ve added an extra Insights section. It simply displays the impact of some of the areas we’ve been discussing above. 
You can see in the top chart, where the different change points are. Further down you get insights into how the different seasonal trends are impacting the predictions, etc. ClosingI’ve always looked for ways to predict in advance what’s coming my way. It’s always better to show your boss or client that a slowdown is expected a week before it happens rather than try to explain it after the fact. Additionally, this insight can also help you plan your strategy. Your work may be different when in your peak traffic points, than it is when you’re in a lull. You can look back over your analytics trends month-by-month, year-by-year and try to piece it together – or just let machines do what machines do best. Just a reminder, if you got to the bottom and wanted to get to the Colab to run this yourself, you’ll find it here. The post Forecasting web traffic using Google Analytics and Facebook Prophet appeared first on Search Engine Land. via Search Engine Land https://ift.tt/Ltp1s3z
0 Comments
Leave a Reply. |
Archives
April 2024
Categories
|
